
Martingale:
Imagine you’re flipping a fair coin. If it’s heads, you win a dollar, and if it’s tails, you lose a dollar. Over time, even though you may have ups and downs, there’s no overall trend or direction in your winnings. In the long run, you’re just as likely to be ahead as you are behind. This is like a martingale – it doesn’t have a predictable direction.
Semi-martingale:
Now, imagine you’re still flipping that coin, but this time, regardless of whether you win or lose on each flip, you also slowly and steadily gain a few cents because of some side activity (like maybe you’re performing a song for onlookers while flipping the coin). You still have the random ups and downs from the coin flips, but there’s also this predictable component where you’re gradually gaining a bit over time. This combined effect, the unpredictable coin flips plus the steady gain, is like a semi-martingale. It has both a random part and a predictable trend.
A semi-martingale is a mathematical concept commonly used in the field of probability theory and, in particular, in stochastic calculus. It is a type of stochastic process that generalizes martingales and local martingales. Essentially, it captures the idea of a process that has both a martingale part and a bounded variation part.
More formally, a real-valued process Xt is called a semi-martingale if and only if it can be decomposed as:
Xt = Mt + At
where Mt is a local martingale and At is a process of bounded variation over every finite interval.
In the context of finance, semi-martingales are often used to model asset prices, especially when the price dynamics combine both stochastic (random) elements and deterministic trends.
To understand it intuitively, consider that a martingale is a "fair game" in the sense that its future expected value is always its present value. A semi-martingale allows for some drift or trend but also has this "fair game" element to it.
NB:
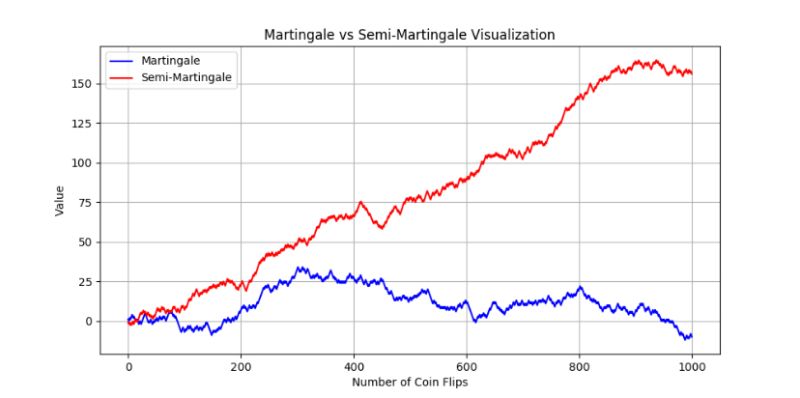
The chart visualizes the outcomes of 1,000 coin flips, comparing the results of a martingale process to those of a semi-martingale process:
1. Martingale (Blue Line):
- Represents a sequence where each outcome (heads or tails) results in either a gain or loss of one unit.
- The line fluctuates up and down based purely on the randomness of each coin flip.
- Over 1,000 flips, there's no discernible trend or direction. The value can be above or below the starting point, depending on the outcome of the flips.
2. Semi-Martingale (Red Line):
- Similar to the martingale in terms of the coin flip outcomes, but with an added steady increase over time.
- Even with the randomness of the coin flips, this line generally trends upwards due to the predictable component.
#Martingale #SemiMartingale #CoinFlip #ProbabilityTheory#StochasticProcess #MathConcepts #StochasticCalculus
Write a comment