
The spot rate \( r_n \) is the interest rate used to discount a risk-free cash flow received in \( n \) years. It represents the yield on a zero-coupon bond maturing in \( n \) years.
Imagine you invest 100 today, and you know that in 3 years, with a 5% annual spot rate, your investment will grow to:
\[ 100 \times (1.05)^3 = 115.76 \]
This means that the 3-year spot rate \( r_3 \) is 5%.
However, in financial markets, we rarely have spot rates for every maturity. Instead, the market mostly provides par rates—the yield-to-maturity (YTM) of coupon-paying bonds that are issued at 100.
Question: How do we infer the missing spot rates \( r_1 \) and \( r_2 \)?
Since zero-coupon bonds are often unavailable, we need to extract spot rates from coupon-paying bonds while ensuring a no-arbitrage framework.
One natural reason we might want to determine different spot rates is to check whether there is an arbitrage opportunity. If a bond is mispriced relative to the theoretical discounting using spot rates, we could exploit this by buying or selling the bond accordingly. Without an accurate yield curve built from spot rates, it is impossible to detect such inefficiencies.
In practice, different instruments are used to extract spot rates depending on the market:
In the United States, Treasury securities such as Treasury bills (T-bills), Treasury notes, and bonds are used. T-bills, being short-term zero-coupon instruments, provide accurate data points for the short end of the curve, while Treasury notes and bonds help extend the curve for longer maturities.
In Europe, the Overnight Index Swap curve (OIS)1 is commonly employed as a proxy for the risk-free rate to construct the discount curve.
Since zero-coupon bonds rarely trade, the best available data comes from par bonds (bonds issued at 100 that pay annual coupons).
Key Insight: The par rate contains all the information needed to extract spot rates.
- A zero-coupon bond only pays one lump sum at maturity.
- A par bond pays periodic coupons plus 100 at maturity.
- The market efficiently prices par bonds, meaning their prices embed spot rate information.
This allows us to extract spot rates iteratively using a method called bootstrapping.
The Bootstrapping Process
We use par bonds of increasing maturity to extract spot rates one step at a time.
Extracting \( r_1 \) from a 1-Year Par Bond
Consider a 1-year bond issued at 100 with an annual coupon equal to its YTM (\( y_1 \)):
\[ 100 = \frac{y_1 + 100}{1 + r_1} \]
Since the bond is issued at par (100), its par rate (\( y_1 \)) is also its 1-year spot rate (\( r_1 \)):
\[ r_1 = y_1 \]
First spot rate = 1-year par rate.
Extracting \( r_2 \) from a 2-Year Par Bond
Now, consider a 2-year bond issued at 100 that pays an annual coupon \( y_2 \):
\[ 100 = \frac{y_2}{1 + r_1} + \frac{y_2 + 100}{(1 + r_2)^2} \]
Since we already solved for \( r_1 \) in the previous step, we substitute it here.
We solve for \( r_2 \).
Second spot rate = solved from the 2-year par bond using \( r_1 \).
Extracting \( r_3 \) from a 3-Year Par Bond
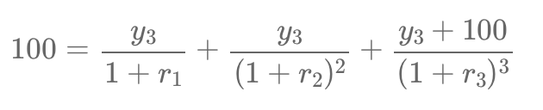
Now, we take a 3-year bond issued at 100, paying a coupon \( y_3 \):
\[ 100 = \frac{y_3}{1 + r_1} + \frac{y_3}{(1 + r_2)^2} + \frac{y_3 + 100}{(1 + r_3)^3} \]
We already solved for \( r_1 \) and \( r_2 \).
We solve for \( r_3 \).
If the calculated \( r_3 \) matches our known 5% 3-year spot rate, our process is validated.
Third spot rate = solved from the 3-year par bond using \( r_1 \) and \( r_2 \).
Knowing the spot rate curve is essential for correctly pricing fixed-income instruments.
Furthermore, once spot rates have been determined, forward rates can be derived from them using the no-arbitrage principle. Since spot rates capture the necessary time value of money information, they allow us to compute forward rates that can be used for pricing derivatives.
1 The OIS curve is preferred because it reflects near risk-free rates based on secured interbank lending rather than government bonds, which may carry additional risks.
🎓 Formation recommandée : Les fondamentaux des marchés de taux
Approfondissez votre compréhension des marchés obligataires et des taux d'intérêt. Cette formation couvre les mécanismes fondamentaux des marchés de taux, les produits de taux et leurs applications en gestion de portefeuille et en couverture des risques.
Découvrir la formation
Écrire commentaire